


 6 minutes
Fighting churn may seem impossible – a battle you can never indeed win. Without proper understanding, it is like shooting in the dark in the hope of hitting something that works. User retention analysis puts the power back in your hands, so you can create an effective, data-driven plan to stay ahead of churn.
What is User Retention Analysis?
The analysis involves examining how long users remain active in your application. What factors contribute to the fact that customers stay or leave? These ideas are the foundation for building a successful marketing strategy for your company’s retention and sustainable growth.
How do you analyze user retention?
In part, app retention is becoming a sticky topic because there is no one-size-fits-all solution to churn.
Every app is unique, every user is different, and there is no silver bullet for everyone. Everyone must develop their strategy based on their unique customer base and product.
Before you start analyzing user retention, you need to answer a few questions about your specific application.
1. Who considers an active or inactive user?
Before you can measure churn or calculate retention rates, you must determine which users meet your criteria for each one.
Some applications consider anyone who launches an application to be an active user. Others consider the user active only if they have completed several levels.
We recommend linking your criteria to KPIs in your app, which are directly related to KPIs.
2. What are users doing in your application?
Look not only at launching applications. How meaningful is the relationship between user and application? What actions, features are associated with higher user retention?
This is why real-time analytics is so important to marketers. Understanding what users are doing in your app right now is the difference between timely campaigns.
With the answers to the above questions, you’re ready to measure your app’s retention rate.
How do you calculate your user retention rate?
To calculate retention, you need to take the number of users left at the end of the test period and compare it to the number of users you had at the beginning of the period. After that, divide the difference by the number of clients at the start of the test period. To measure retention as a percentage, multiply by 100. Below is an example:

What is a User Retention Report?
The User Retention Report is a visual graph that breaks users into groups based on when they first took a specific action, such as starting an app and returning. This is one way for marketers to track retention over time to identify trends and determine when most new users are leaving.
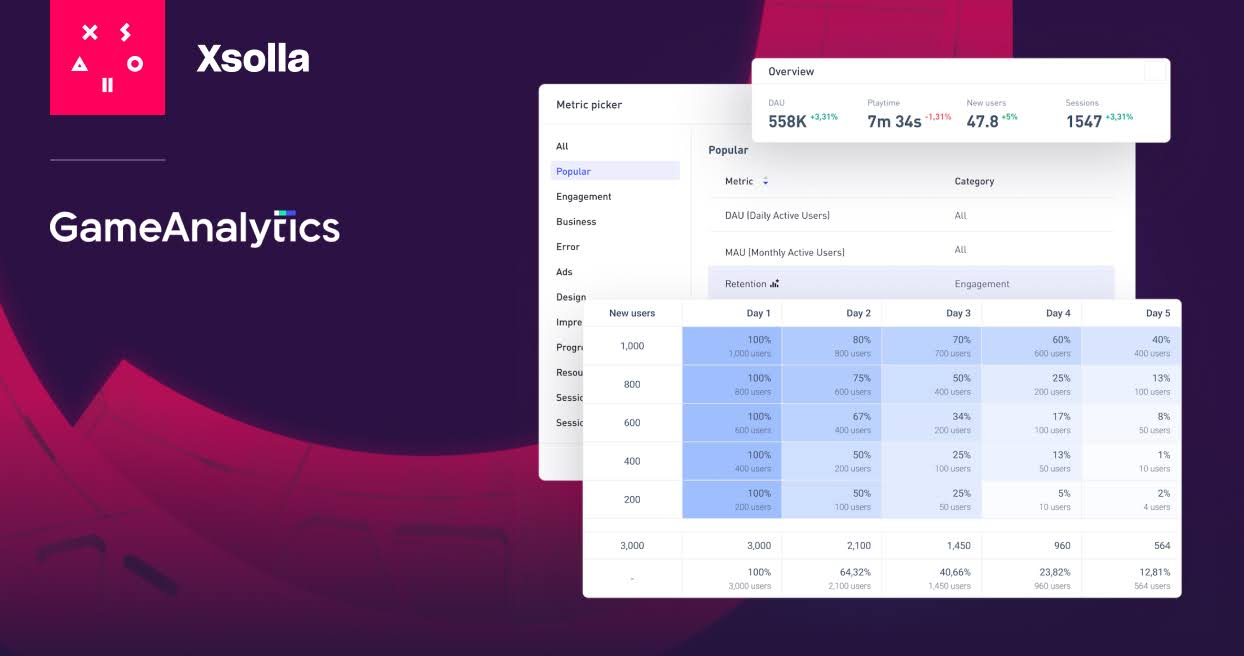
Here is a sample retention chart (cohort chart):

This graph shows a series of cohorts (groups) of new users who downloaded and first launched an app on a specific day. The graph also shows how many will return to launch the application over the next ten days.

With cohort analysis, you can see where the most significant drop in user retention is happening, so you know your timeline for acquiring new users. Also, you will know where on the customer journey you should focus your marketing efforts to increase retention.
Analytics + Action = Retention Increase Formula
Retention analysis is an essential step towards user retention and the development of your app. But this is only the first step.
How often do new users come back?
You can see precisely when and how often new users come back to your app with retention cohorts.
Go beyond baselines to track how different user groups behave throughout the player’s lifecycle, from download to deletion. Compare cohorts by the source of acquisition, geography, customer type, in-app behaviour, and more to see how your marketing retention strategies affect different customers.
With this information, you can create omnichannel onboarding campaigns that bring new users back to your app, help them experience the value of your app, and prepare them for conversions.

Where do users go? How do know that? What if we will use funnel analysis? It helps you to understand exactly how people interact with your application. It visualizes the user’s journey to show how many people perform key actions in the app that contribute to retention and at what point they leave.
It is a powerful tool for calculating what users want from your application. Compare funnels to focus on user trends across regions, technology, product categories, and more.
This information is critical to inform your growth strategy. You can fine-tune your targeting and campaign timing for better engagement, ROI, and retention with responses.

What actions are associated with higher retention and higher churn?
Flows is a powerful analytics tool that shows what users are doing before or after completing a specific event in an app, such as viewing a product, opening a push notification, or deleting your app. With this insight, you will see what activities are directly related to user churn to re-engage users following this path before it’s too late. And you will improve the user experience and encourage new users to follow in the footsteps of your champions.

Which users are at risk of churn?
RFM Analysis automatically segments your users based on how often and how long they have interacted with your application. You will gain insight into the “Champion Users” to support them as loyal customers and brand ambassadors. You can also quickly identify and engage inactive users.
Using RFM availability metrics, you can see which channels are most effective at reaching inactive users and returning them to your application.
From analysis to action
User retention analysis is an important step in understanding how many people use and rate your app. But we cannot stop there.
With the right data analytics tools, marketers gain meaningful insights into the root causes of user churn and, more importantly, predict who is at risk. This deeper understanding is the foundation of effective engagement campaigns that build meaningful relationships with players, build loyalty, and make users fall in love with your app.
1,709


 2 minutes